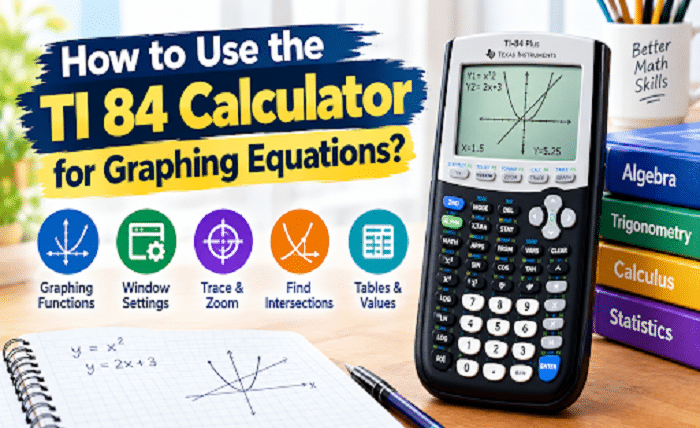
Graphing equations can feel confusing when you have to work with several values, tables, and curves at the same time. A calculator can make the process much easier by showing how an equation behaves on a coordinate plane. The Ti 84 Calculator is widely used by students, and resources such as ti84calculatorr.com can also help learners understand its features and graphing functions.
Learning to graph equations does not require advanced calculator skills. Once you understand where to enter an equation, how to set the viewing window, and how to read the graph, you can quickly check your work. Whether you are practicing basic algebra or working with more advanced functions, learning these calculator steps can make graphing much easier.
Turn On the Graphing Mode
Start by pressing the Y= button near the top of the calculator. This screen contains the functions that the calculator will graph.
You will see entries such as Y1, Y2, Y3, and more. Each line can hold a different equation, allowing you to compare multiple functions on the same graph.
For example, if you want to graph:
y = 2x + 3
Enter 2X + 3 next to Y1. Use the X,T,θ,n button to enter the variable X. You do not need to type the equation using the same format you would use on paper.
After entering the equation, press GRAPH. The calculator will draw the function based on your current graph settings.
Set the Graph Window
Sometimes the graph appears too small, too large, or partly outside the screen. This usually means the viewing window needs to be changed.
Press the WINDOW button to see the current settings. The main values include:
- Xmin: Minimum value shown on the x-axis
- Xmax: Maximum value shown on the x-axis
- Xscl: Spacing between x-axis marks
- Ymin: Minimum value shown on the y-axis
- Ymax: Maximum value shown on the y-axis
- Yscl: Spacing between y-axis marks
For a basic linear equation, a window such as Xmin = -10, Xmax = 10, Ymin = -10, and Ymax = 10 is often a useful starting point.
If you are unsure what settings to use, press ZOOM and select 6. This returns the graph to a standard window and can help you see the equation more clearly.
Use the Ti 84 Calculator Trace Feature
After graphing an equation, the TRACE feature can help you examine individual points on the curve. Press TRACE, then use the left and right arrow keys to move along the graph.
As you move, the calculator displays an x-value and the corresponding y-value. This makes it easier to identify coordinates without calculating every point manually.
The trace function is especially useful when checking:
- Specific coordinates
- Function values
- Approximate intercepts
- Changes in a curve
- Points where two graphs meet
Remember that the displayed values depend on the scale and position of your graph window.
Find Intersections Between Equations
Graphing two equations on the same screen can help you find where they meet.
For example, enter one equation under Y1 and another under Y2. Press GRAPH to display both lines or curves. If they cross, you can use the calculator’s Intersect function to find the approximate coordinate.
Press 2ND, then TRACE to open the CALC menu. Select 5. The calculator will ask you to identify the first curve, second curve, and a nearby guess.
Follow the prompts using the arrow keys and press ENTER when requested. The calculator will then show the intersection point.
This is useful for solving systems of equations graphically and checking answers from algebraic work.
Graph Different Types of Equations
The Ti 84 Calculator can handle many common equation types, not just straight lines. You can use it to explore quadratic, exponential, logarithmic, and other functions.
For a quadratic equation such as:
y = x² – 4x + 3
enter the expression into Y1 and press GRAPH. You should see a curved parabola.
Different equations may require different viewing windows. A quadratic graph, for example, can extend beyond the standard -10 to 10 range. Adjusting Xmin, Xmax, Ymin, and Ymax can reveal more of the curve.
Use Tables to Check Values
The table feature provides another simple way to understand an equation. Press 2ND, then GRAPH to open the table.
The calculator can display x-values along with the corresponding function values. This gives you a quick way to check whether the equation produces the coordinates you expect.
You can also change the table settings by pressing 2ND followed by TBLSET. From there, you can control how the x-values increase and whether the table is generated automatically.
Tables are especially helpful when learning how algebraic expressions connect with points on a graph.
Check Intercepts and Important Points
Many graphing problems ask students to find x-intercepts, y-intercepts, maximum points, minimum points, or other key locations.
The CALC menu provides several useful options for this purpose. Depending on the type of function, you can select options such as zero, minimum, or maximum.
For an x-intercept, choose zero and move the cursor near the point where the graph crosses the x-axis. The calculator can then estimate the value.
These tools should support your mathematical work rather than replace it. Understanding what an intercept or turning point means will help you interpret the answer correctly.
Avoid Common Graphing Mistakes
A few simple mistakes can make a graph look incorrect. Before assuming that your equation is wrong, check the calculator settings.
Common problems include:
- Forgetting to press Y= before entering the equation
- Using the wrong mathematical operation
- Leaving an unwanted equation turned on
- Choosing an unsuitable viewing window
- Entering a negative value incorrectly
- Confusing multiplication with the variable X
- Forgetting parentheses around parts of an expression
If the graph looks strange, return to the Y= screen and check every expression carefully.
Practice With Simple Equations
The easiest way to become comfortable with graphing is to practice with equations that gradually become more difficult.
Start with simple linear equations such as:
y = x + 2
Then try:
y = -2x + 5
After that, move to quadratic functions, exponential functions, and equations containing fractions or parentheses.
Try predicting the graph before pressing GRAPH. Once the calculator displays it, compare your prediction with the actual curve. This habit can improve both calculator skills and mathematical understanding.
Conclusion
Using the Ti 84 Calculator for graphing equations becomes much easier once you know the basic controls. The Y= screen lets you enter functions, the WINDOW settings control the viewing area, and TRACE and CALC help you study important points on a graph. Tables and intersection tools can also make it easier to check algebraic results.
The key is to practice each feature instead of trying to learn everything at once. With regular use, graphing functions, comparing equations, finding intercepts, and checking coordinates can become quick and familiar parts of your math work.